
Charts
Charts provide the ability to take any set of data from a Pivot (and in turn a SQL Wrapper) and slice and dice them in a real time environment visually like in Excel. These charts can be saved and re-used throughout the application much like SQL Wrappers, allowing you to place the charts on custom layouts anywhere for a user to see them immediately when relevant.
Chart Features
Charts work against pivoted data from a Pivot table, which in turn gets its results from a SQL Wrapper. Charts work on data that is pivoted, much like in Excel, to ensure the data points don't overwhelm the graph and the data has been aggregated into a manageable form already.
Charts can be visualised in the following forms:
- Area
- Bar
- Line
- Pie
- Spline
- Spline Area
You can specify the source of the data from rows/columns and and totaling you want applied.
Because Charts work on top of SQL Wrappers, they benefit from all the SQL Wrapper integration technologies [see here for more info]. In particular this includes the parameters setup, and the ability to configure them in layouts to be context sensitive when running in custom layouts.
In addition the data feeding the chart comes from a SQL Wrapper so the underlying data can always be exported into Excel or Excel templates.
Like SQL Wrappers, Charts contain versioning for exporting/importing and consistency across systems.
Designing
Designing a chart is as simple as selecting a data source - any pivot in the system, and specifying the type of chart you would like to create. Just like in Excel the system can provide you a real time view of this as you make changes. Alternatively, if the pivot takes a while to run, you can make changes without the chart updating in real time and when you click run it will start reflecting the changes.
For instance, in this example the following chart is being updated as we make changes:
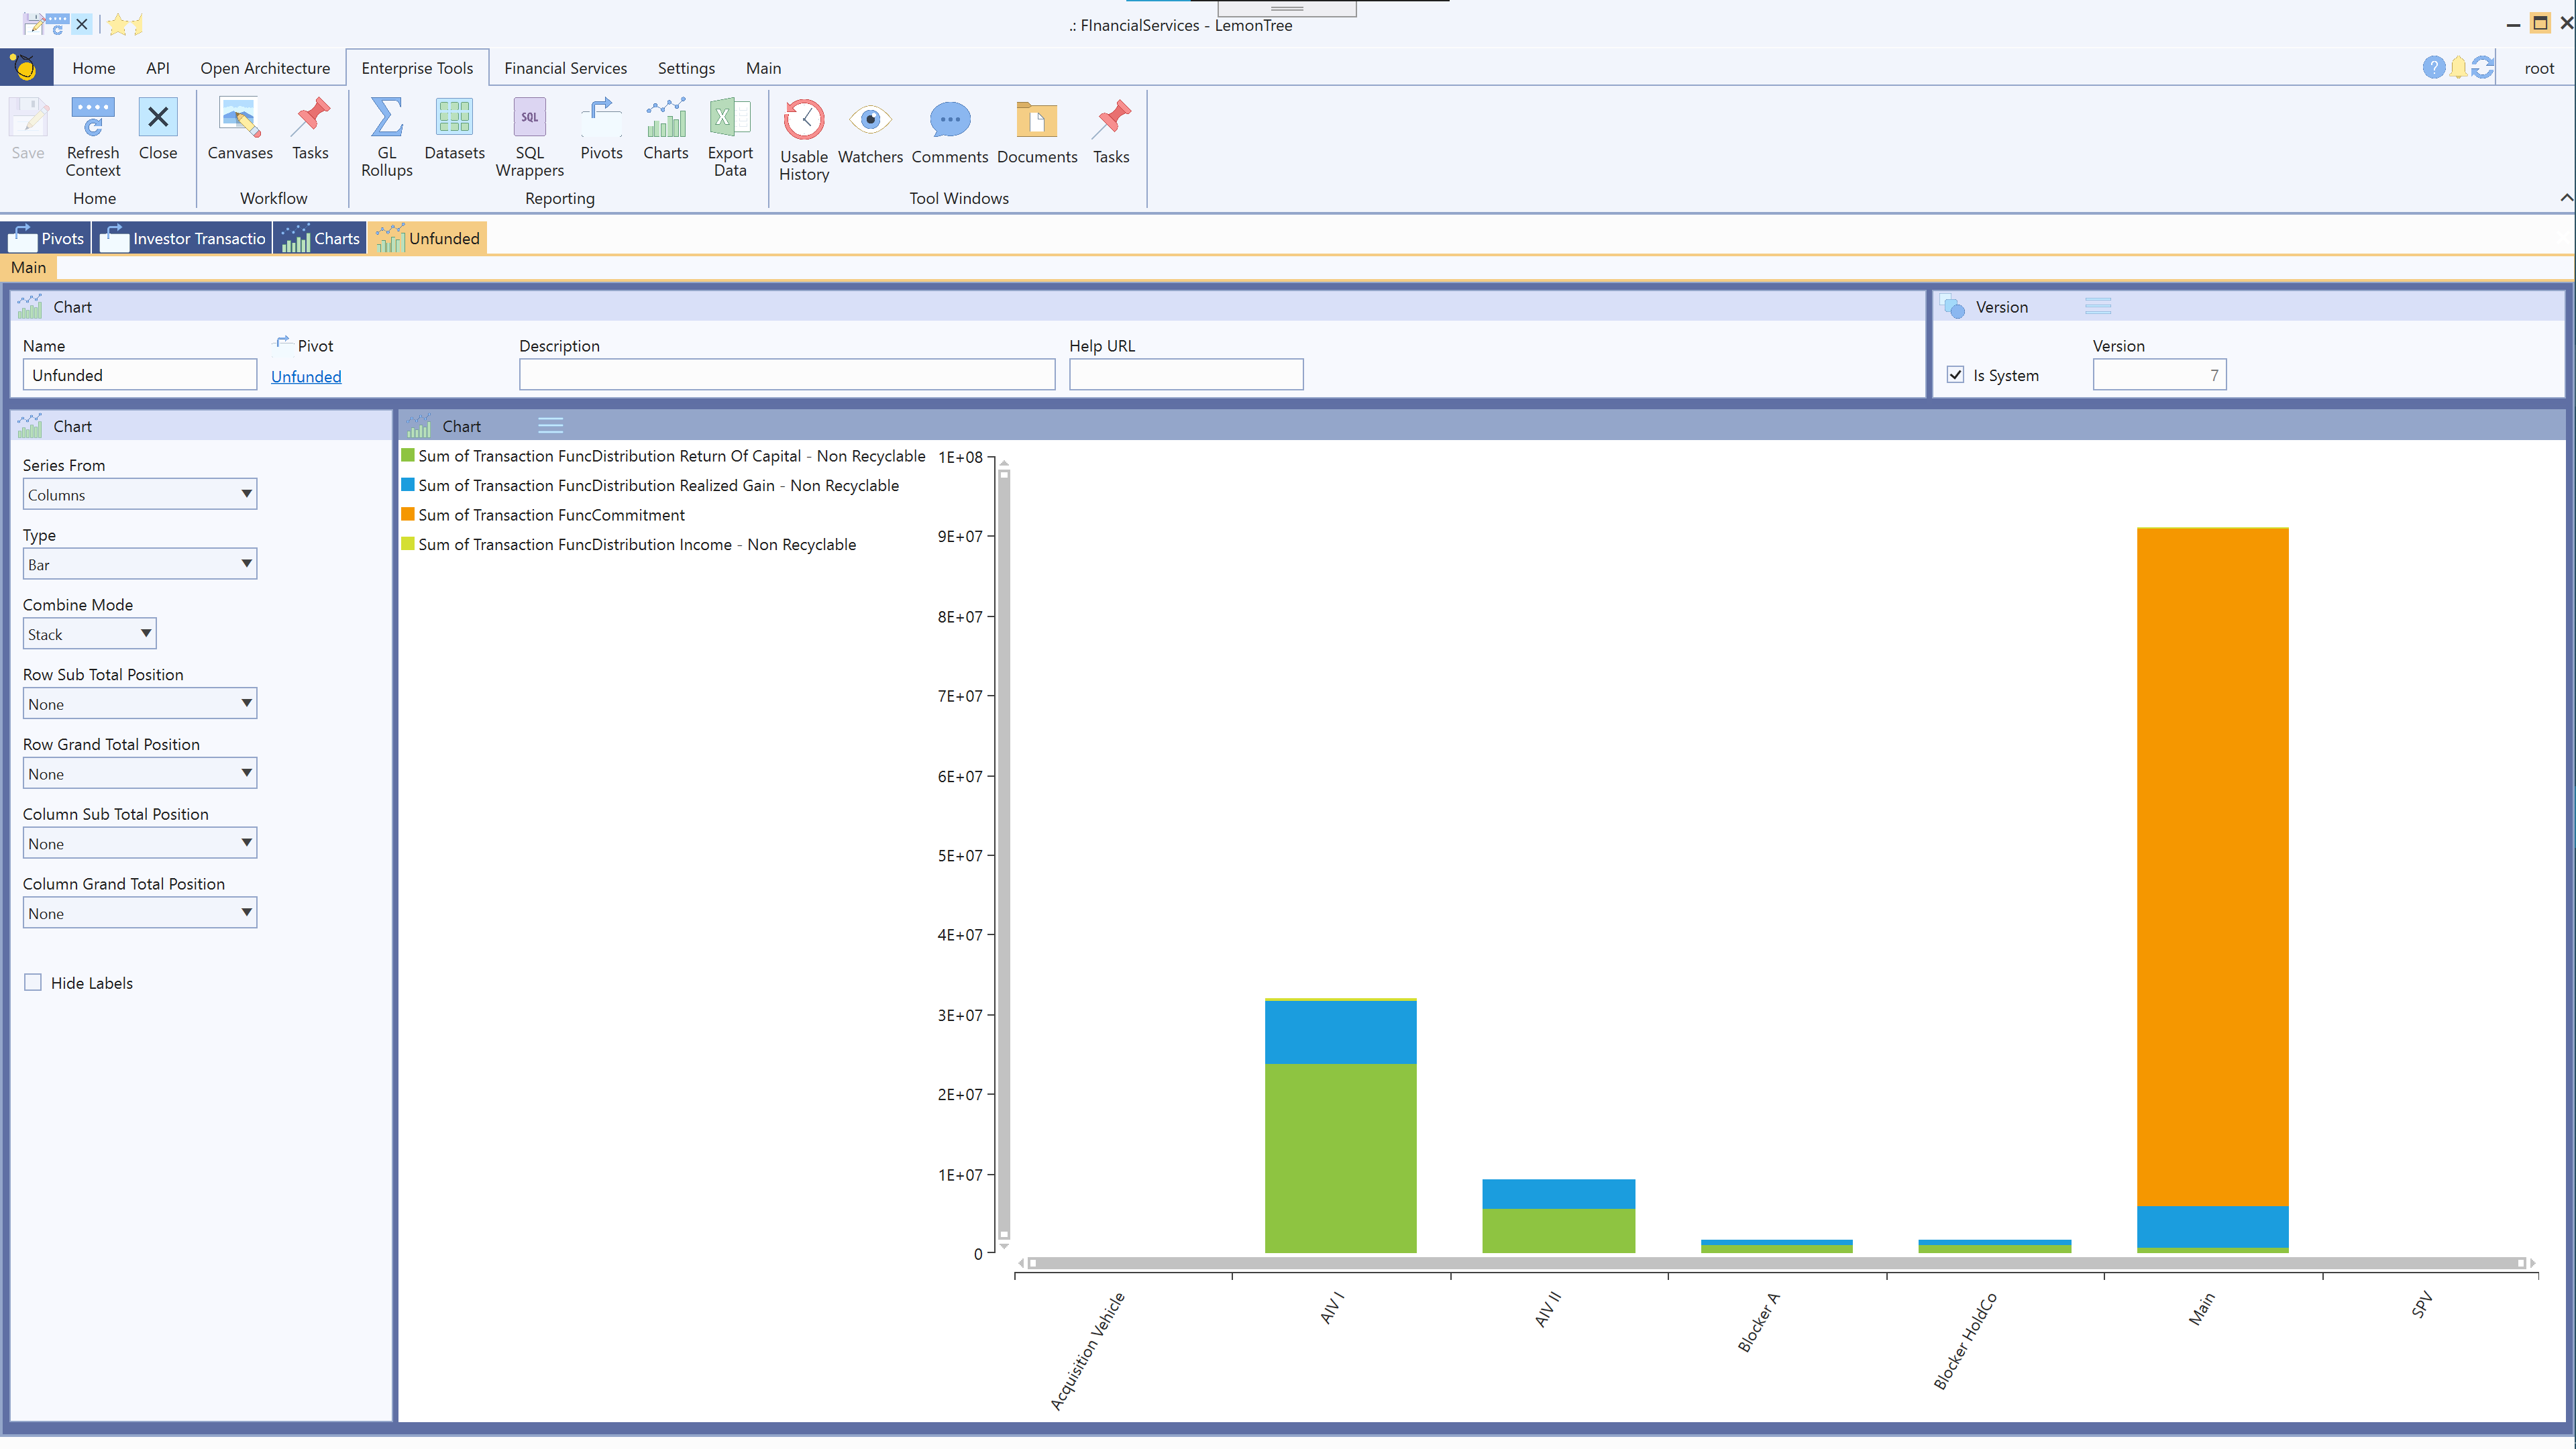
Charts benefit from all the performance enhancements baked into SQL Wrappers ensuring your chart can run as quickly as possible regardless of the size of data it maybe manipulating.
Views
Charts are managed through the following views:

